Motorola Solutions - Avigilon Cloud
AI-Powered System Health Dashboard
Case Study
Overview
I led the experience strategy and redesign of Avigilon Cloud Advanced System Health — an AI-powered dashboard within Avigilon’s enterprise video surveillance platform.
Security integrators, IT administrators, and operators managing thousands of cameras across global sites were overwhelmed by fragmented device data, misleading statuses, and repetitive troubleshooting. The new “single pane of glass” transformed dense, table-driven system telemetry into clear, prioritized, and actionable insights — enabling faster issue detection, guided resolutions, and proactive maintenance at massive scale.
By combining systems thinking with AI-driven health monitoring and scene-based tagging, the platform shifted from reactive firefighting to confident, proactive system management.
My Role
As Director of UX Design – at Motorola Solutions, I owned the end-to-end experience vision and design strategy for this critical capability.
My key contributions included:
Defining the overall experience strategy and information architecture for complex, multi-site health monitoring workflows
Leading a cross-functional team (5 designers, 1 researcher, PMs, and Engineering leads) through vision workshops, journey mapping, and co-creation sessions
Partnering closely with Product, Engineering, and Support to prioritize features and navigate trade-offs between depth of data and usability
Establishing design standards, elevating visual craft, and ensuring WCAG accessibility across dense data views and interactive diagnostics
Driving rapid prototyping with real telemetry data and conducting validation sessions with major enterprise clients
Building a continuous research practice that directly informed the product roadmap
This work strengthened design’s influence in a highly technical, matrixed environment while maintaining a high bar for clarity, trust, and actionable intelligence.
The Problem:
Eroding trust in the product
Many of our enterprise customers rely on hundreds—or even thousands—of IP-connected security cameras across campuses, warehouses, or stores. As security systems scale to thousands of sites, servers, and cameras, finding and managing health and uptime becomes unmanageable. Customers struggled with disconnected and misleading device statuses, lack of actionable insights, and repetitive troubleshooting, leading to eroding trust in the product.
The Solution:
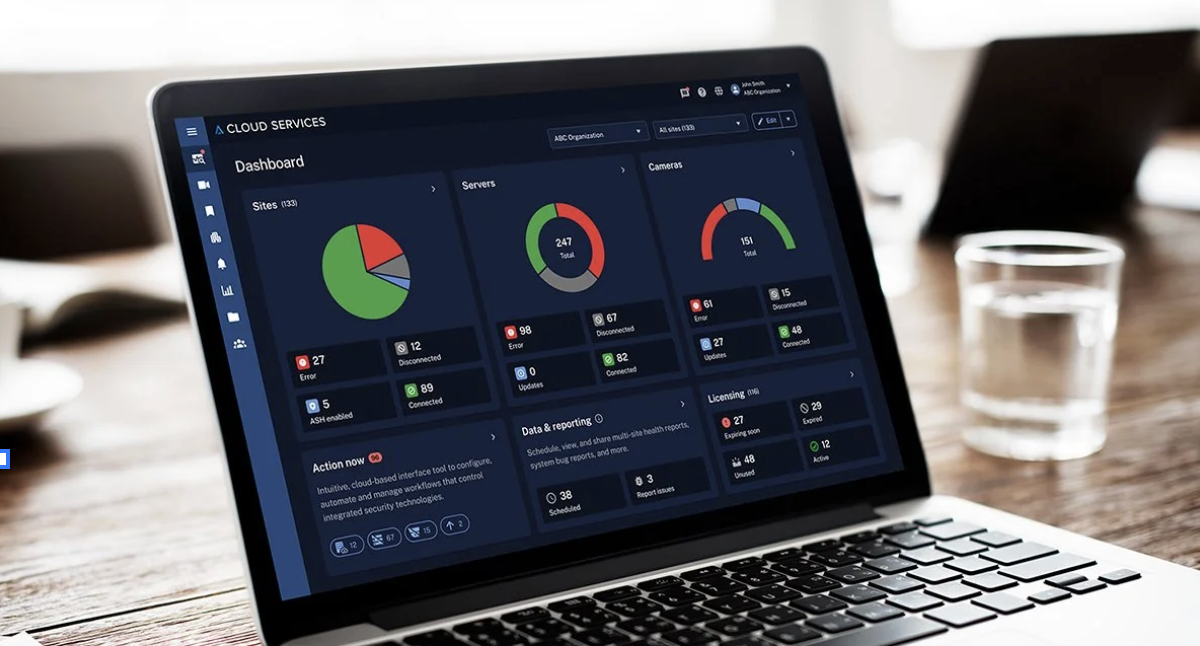
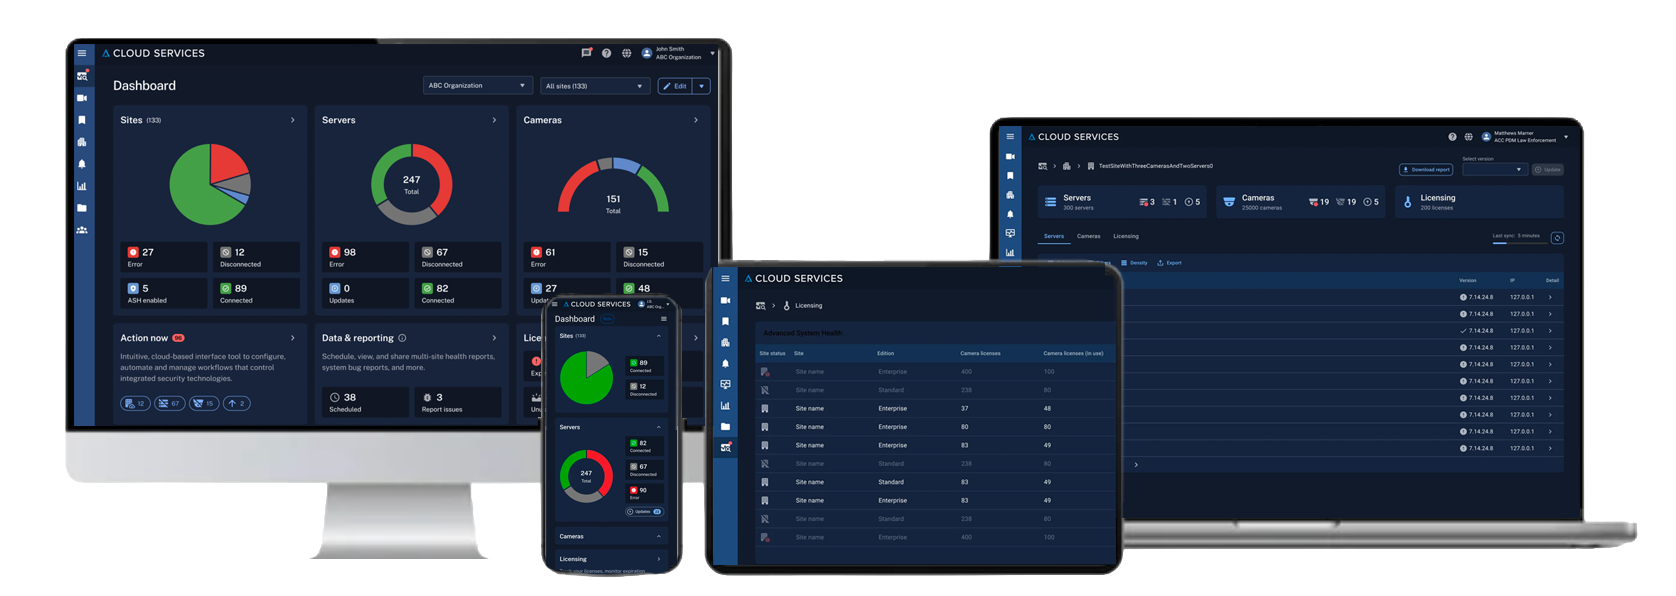
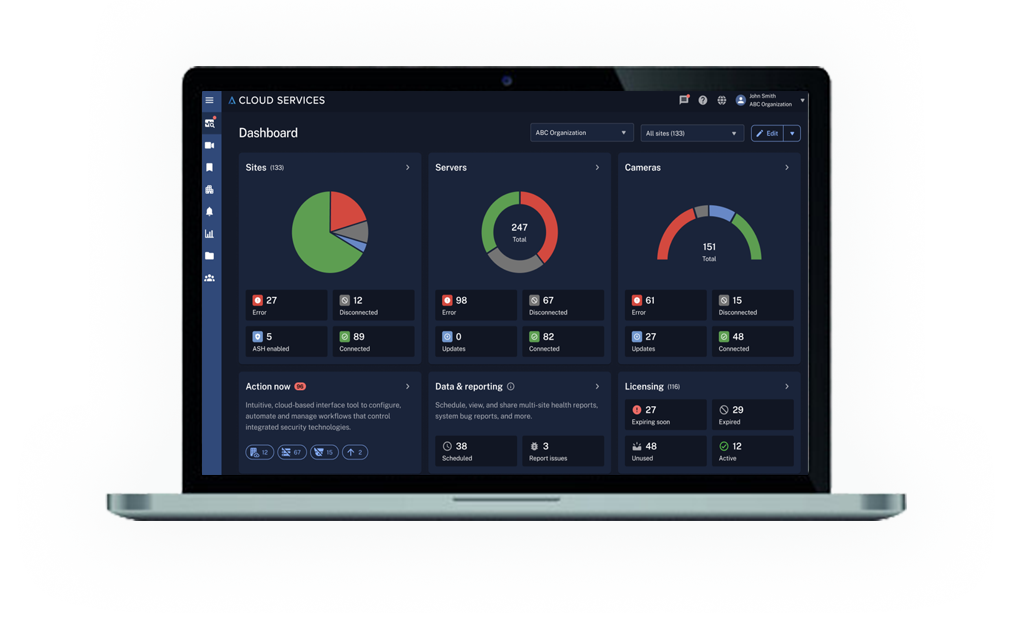
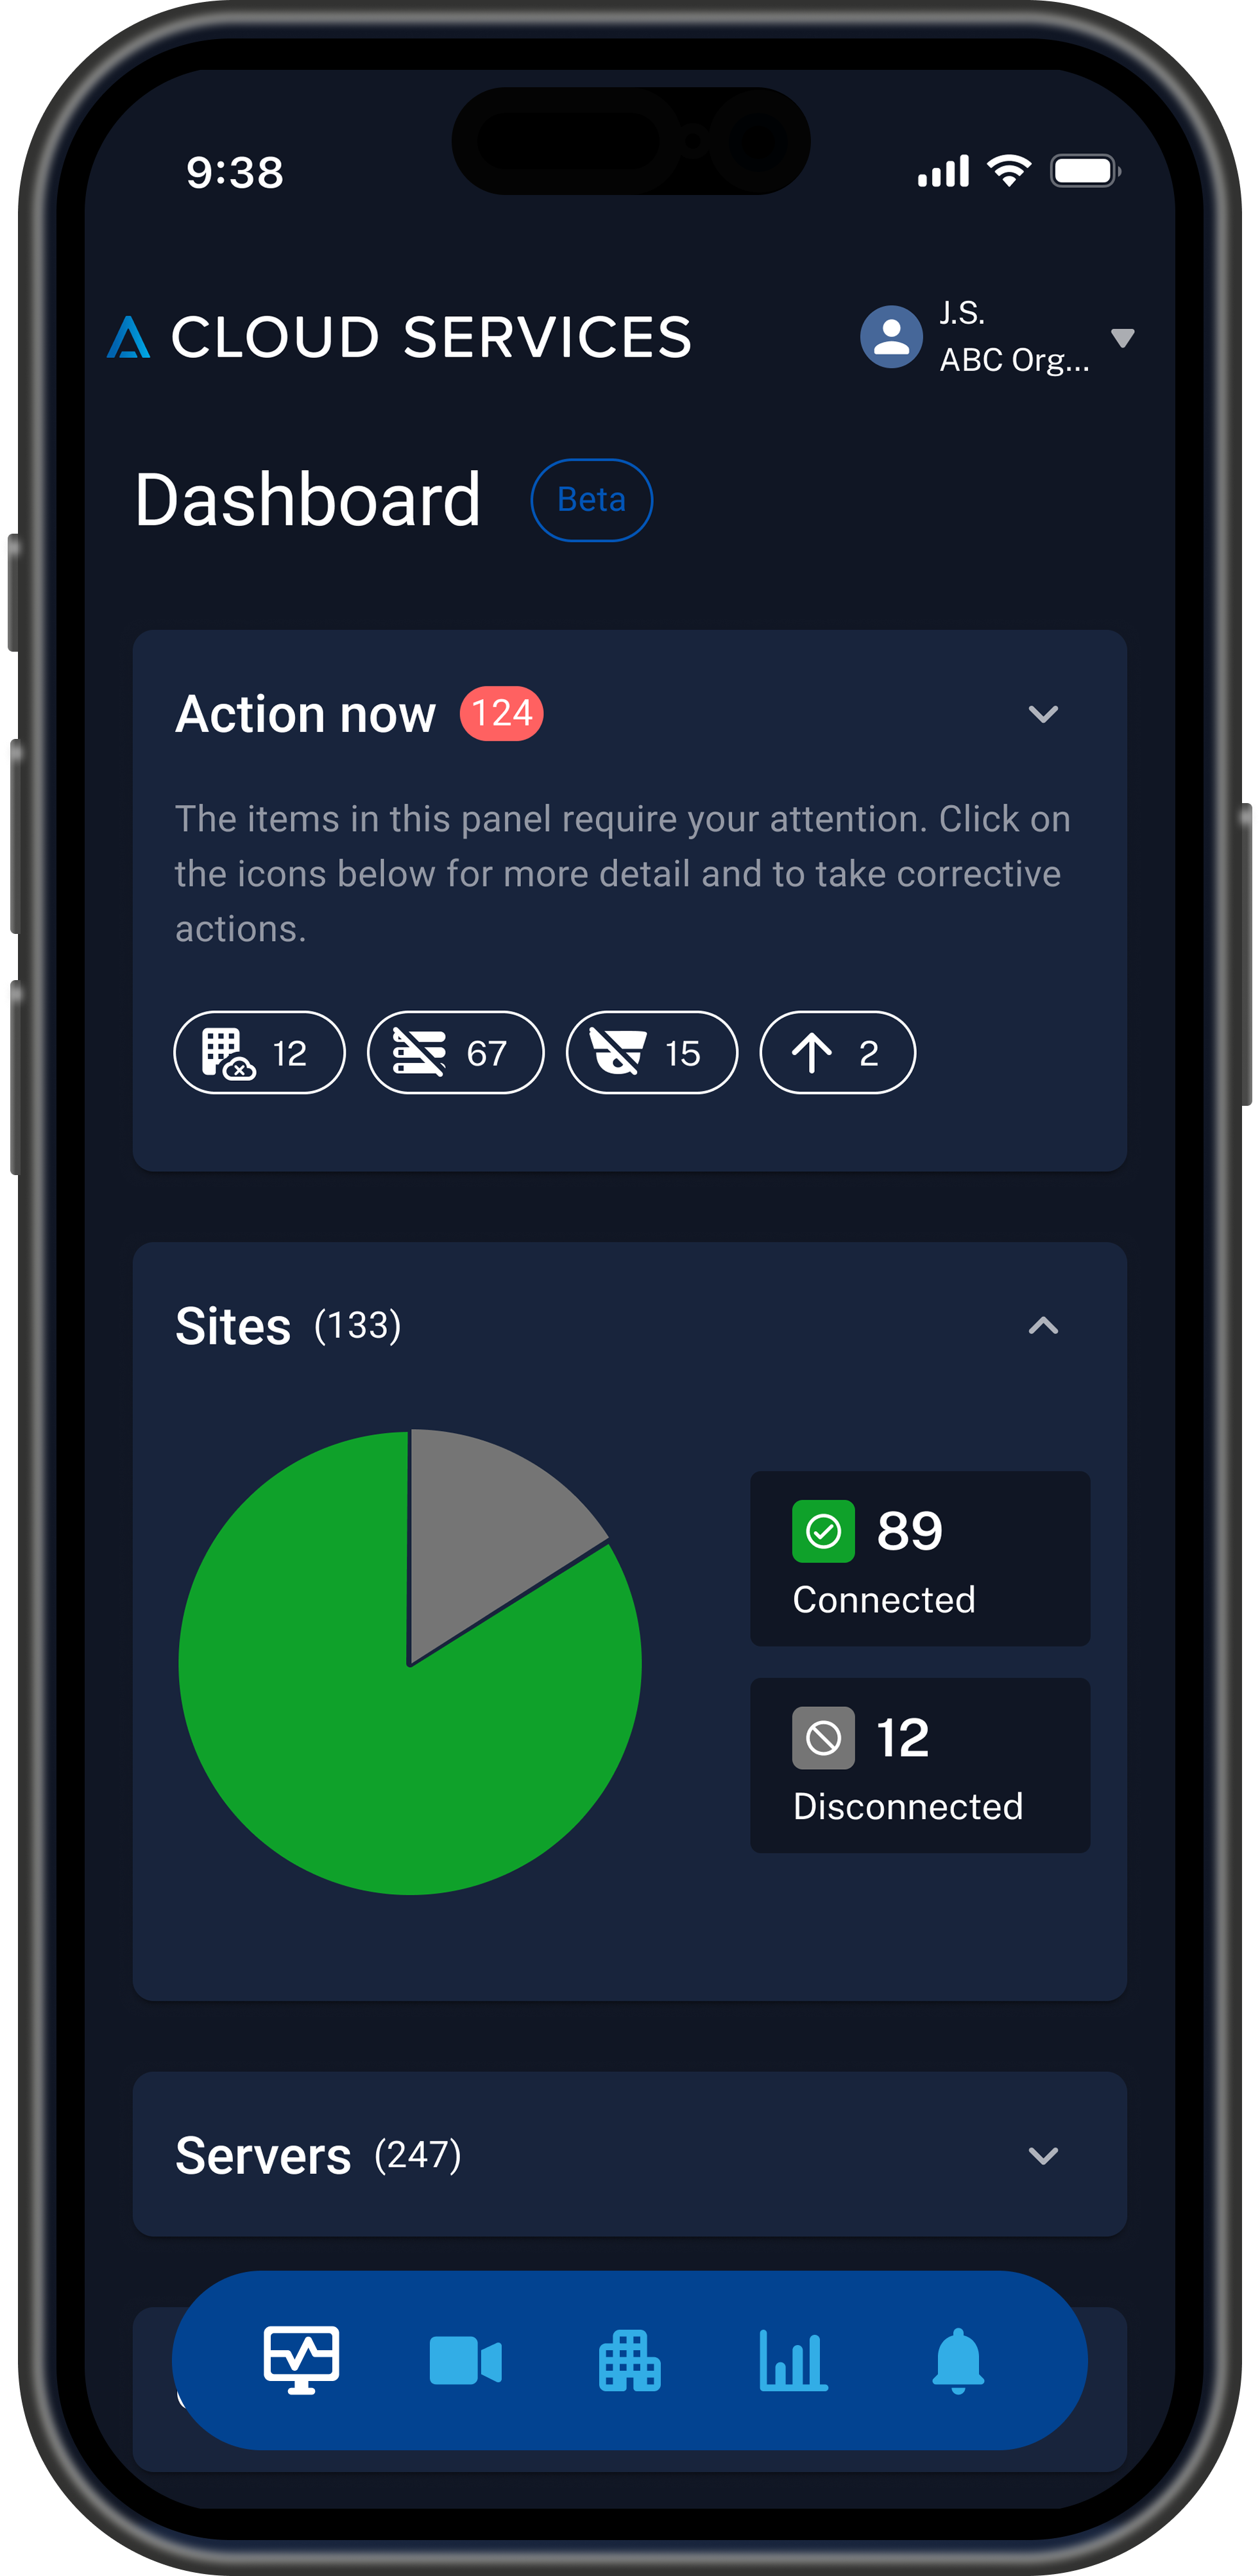
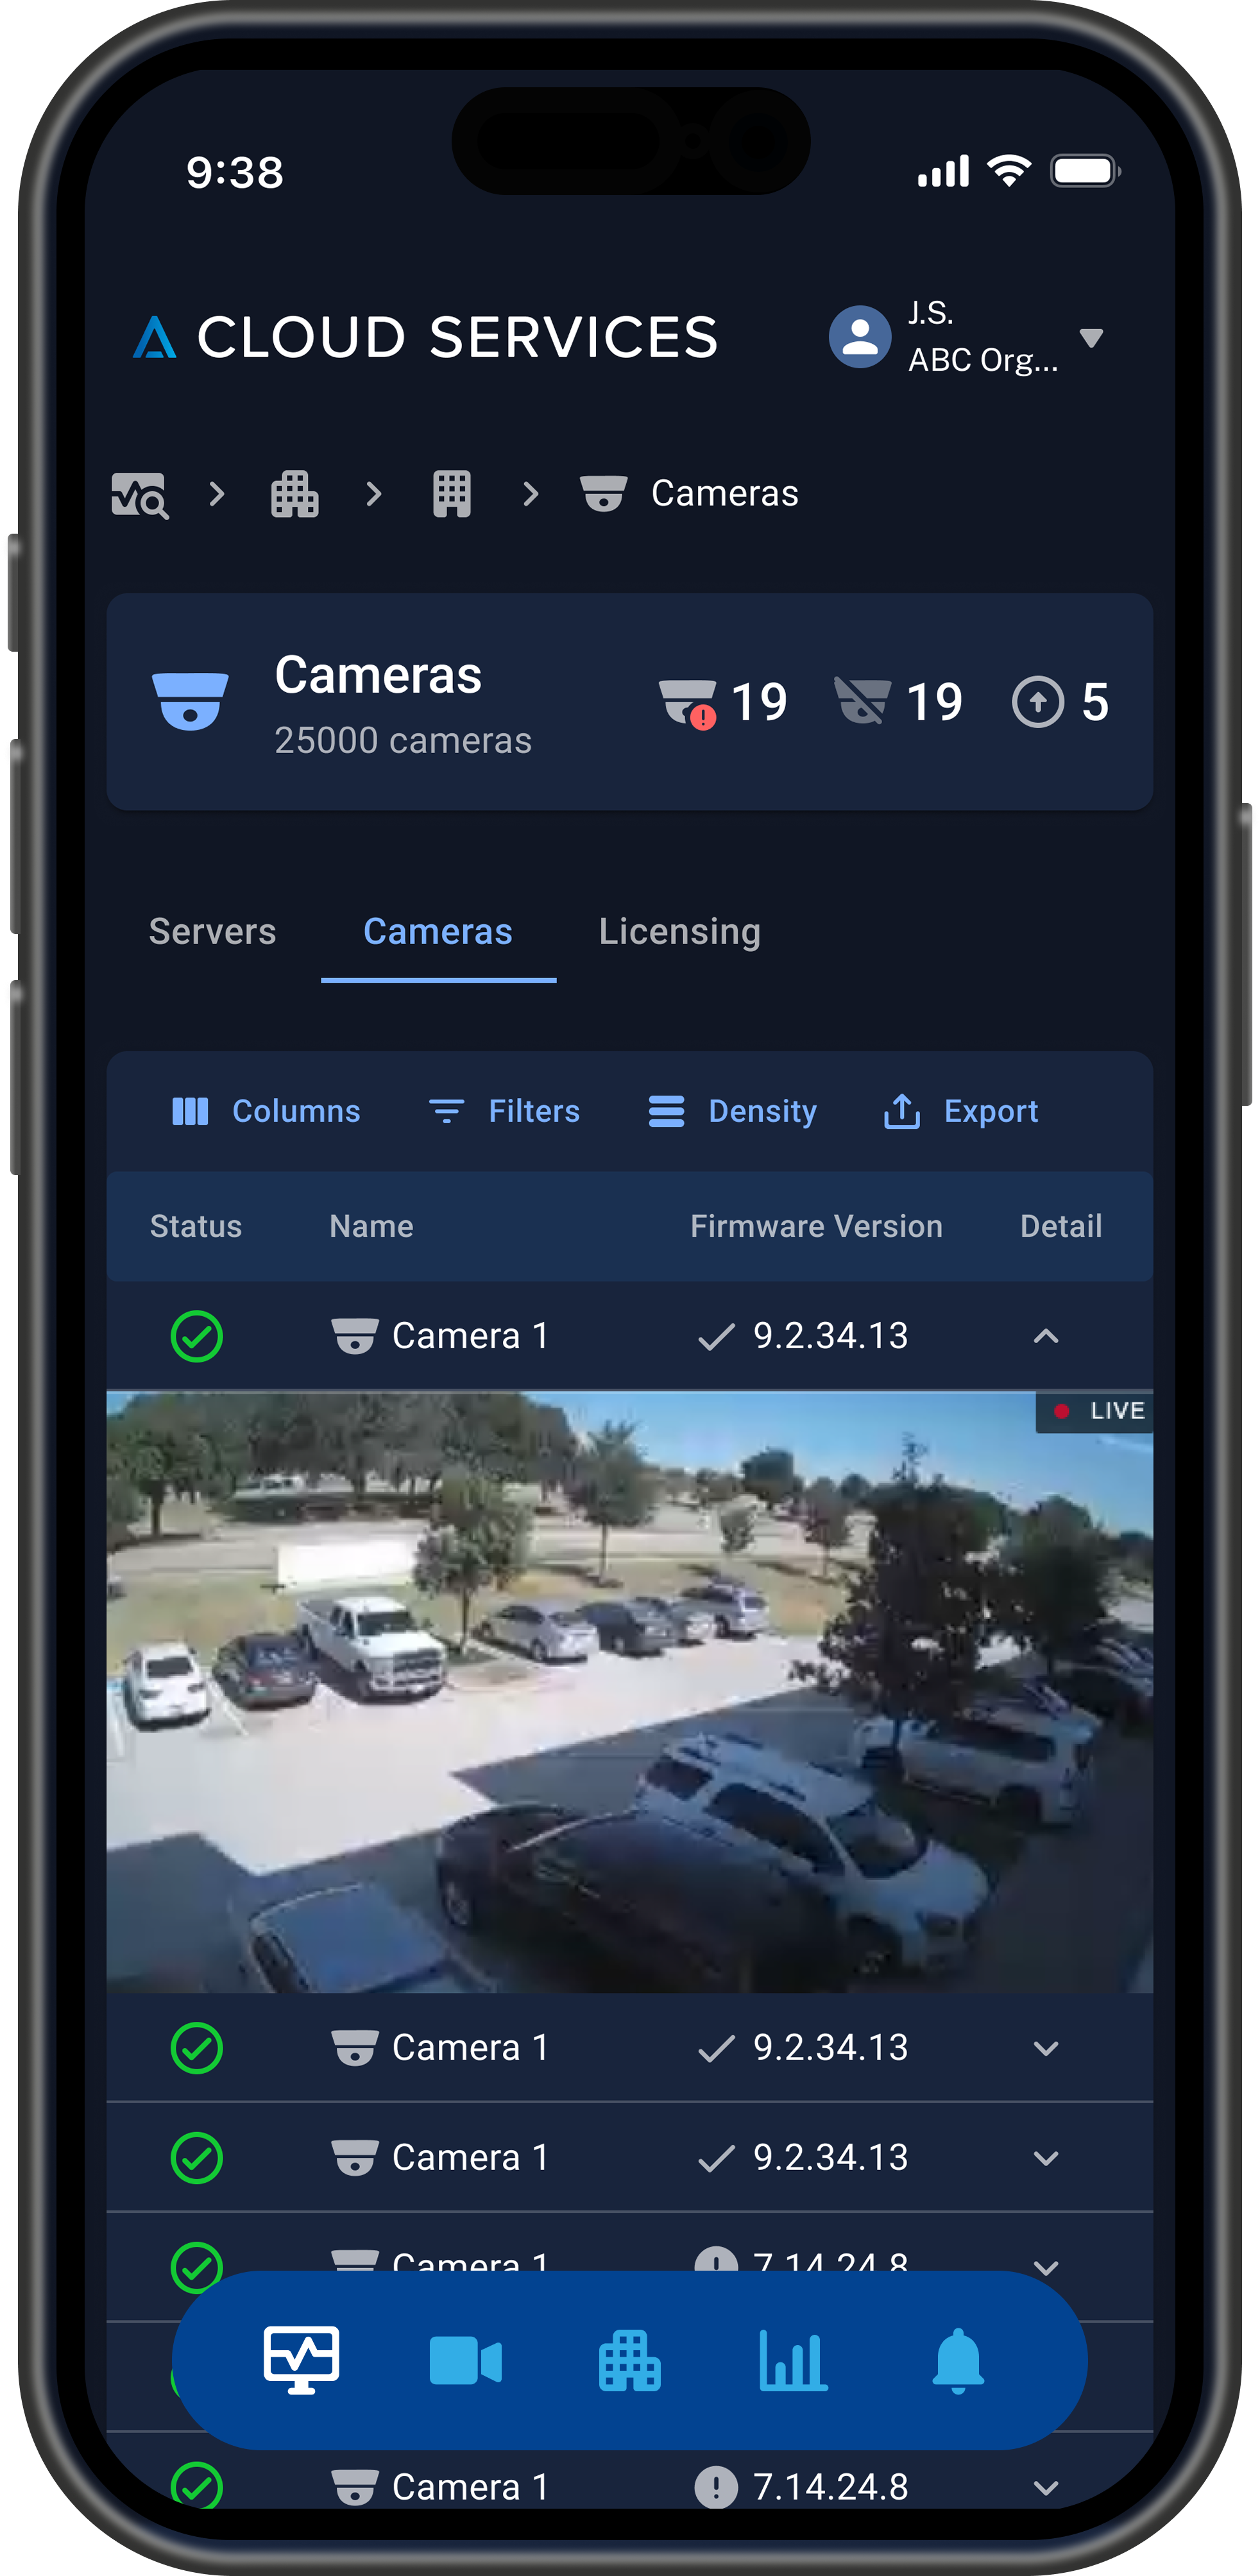
Centralized AI Health Monitoring
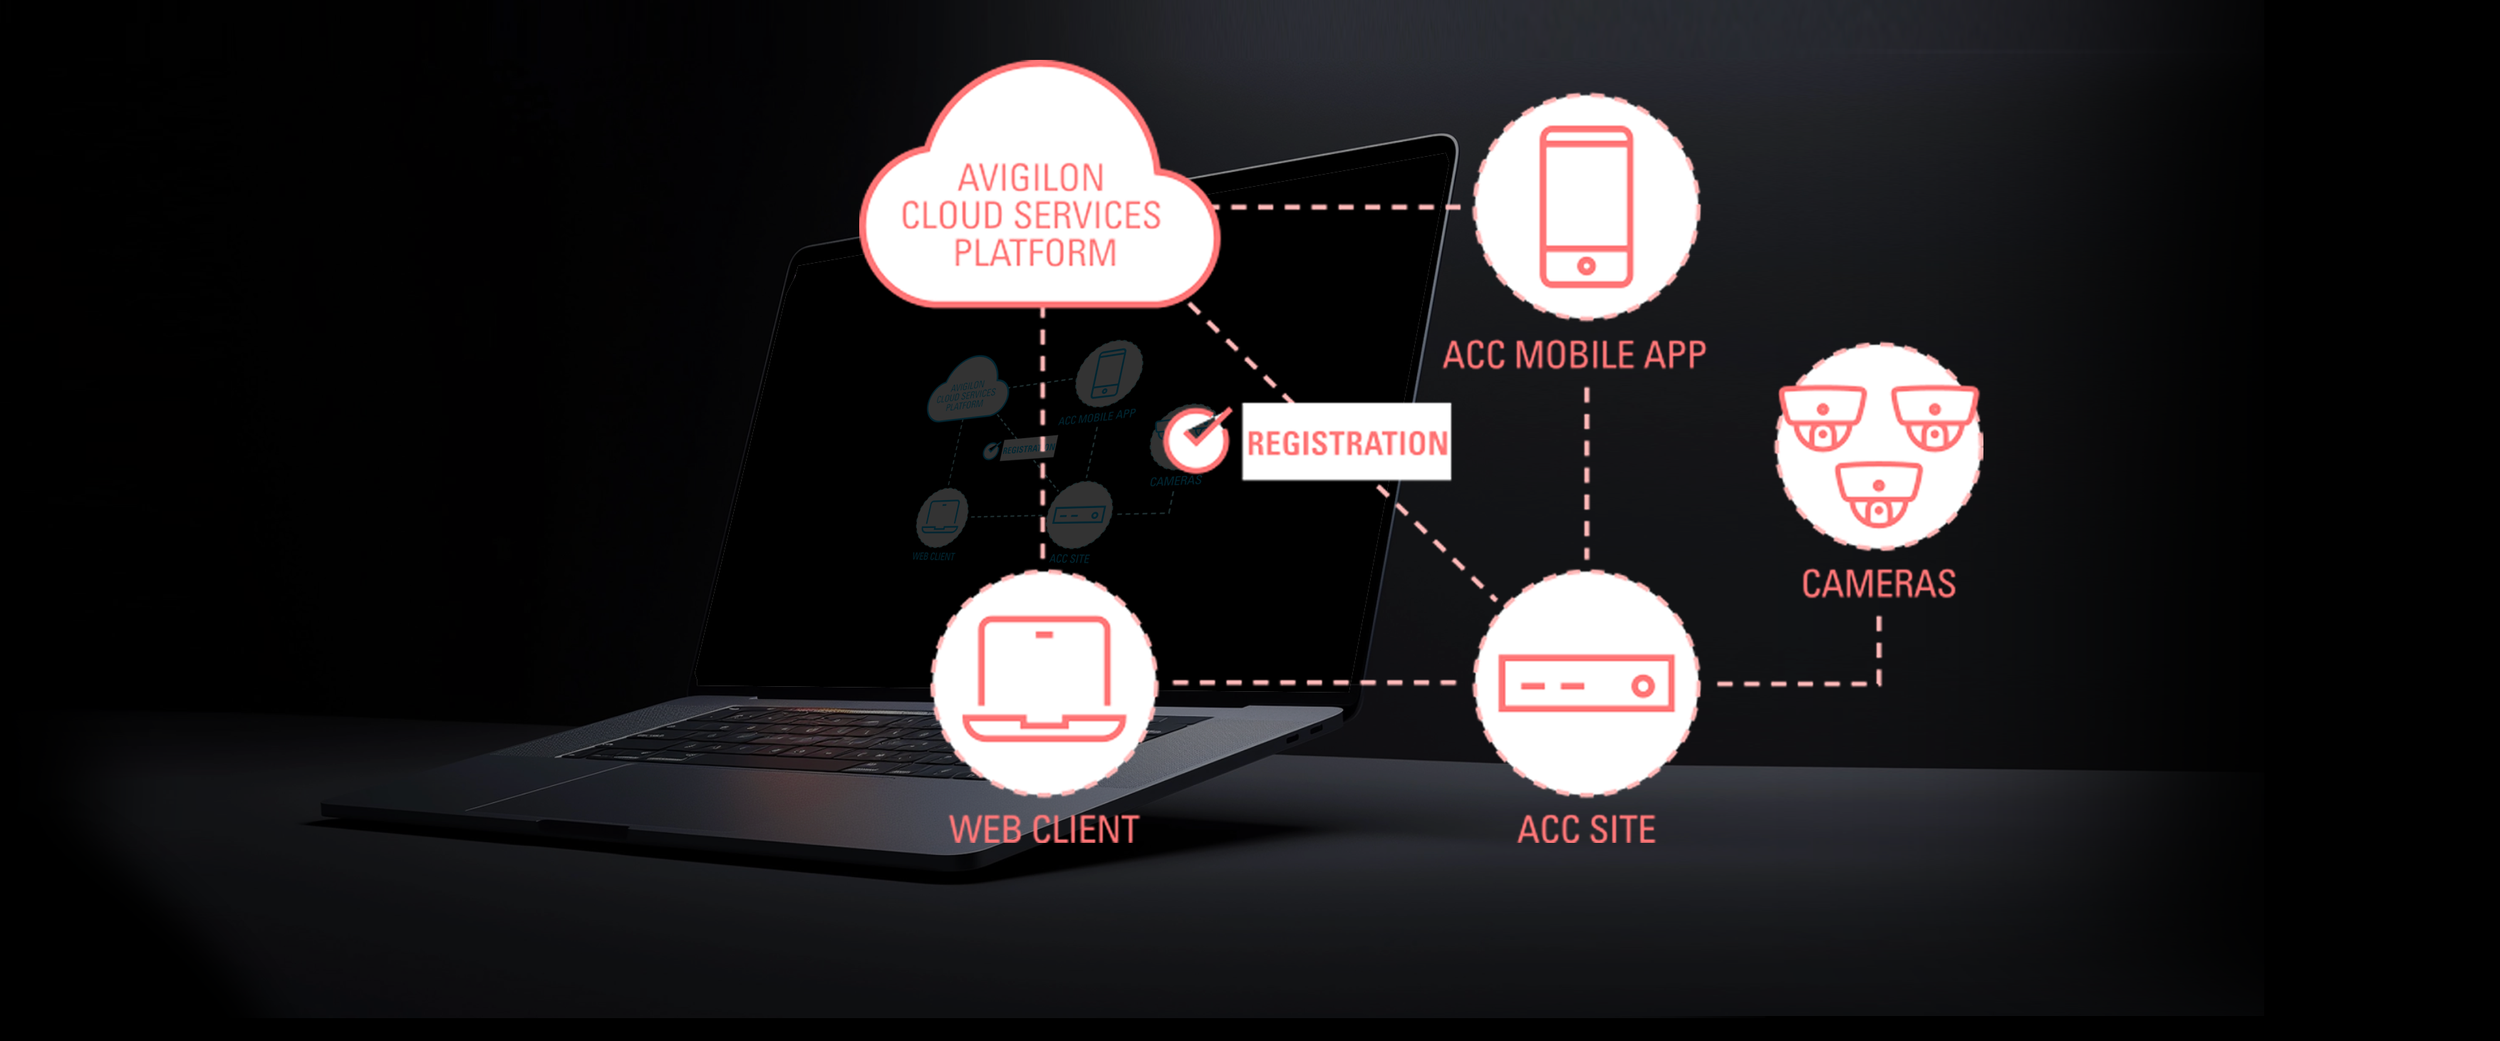
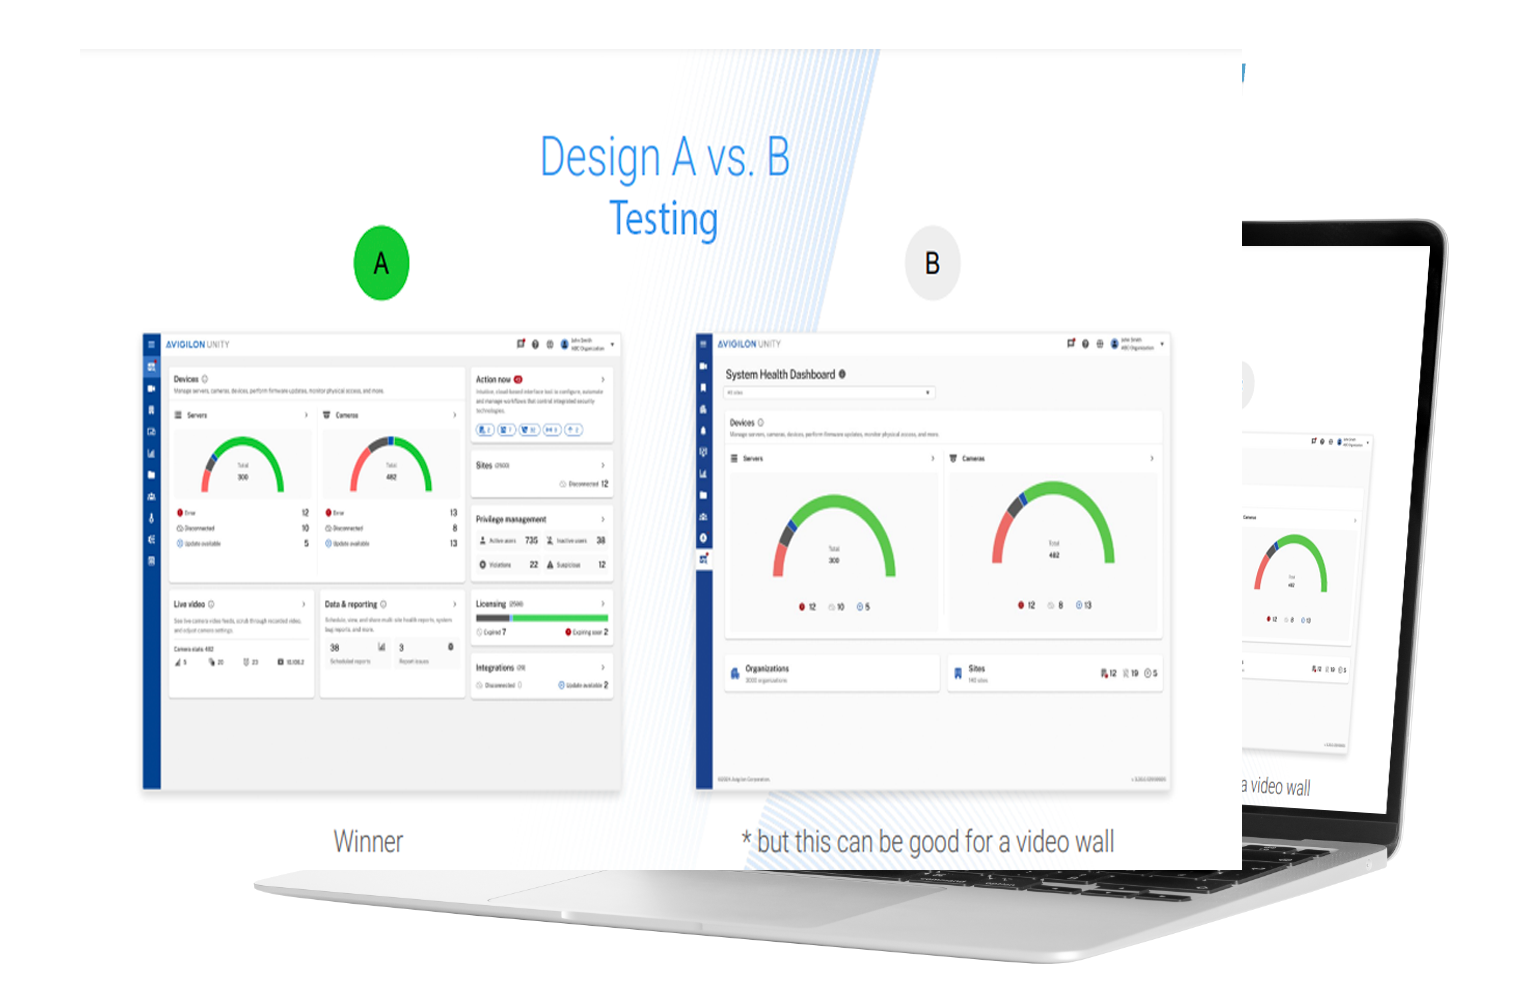
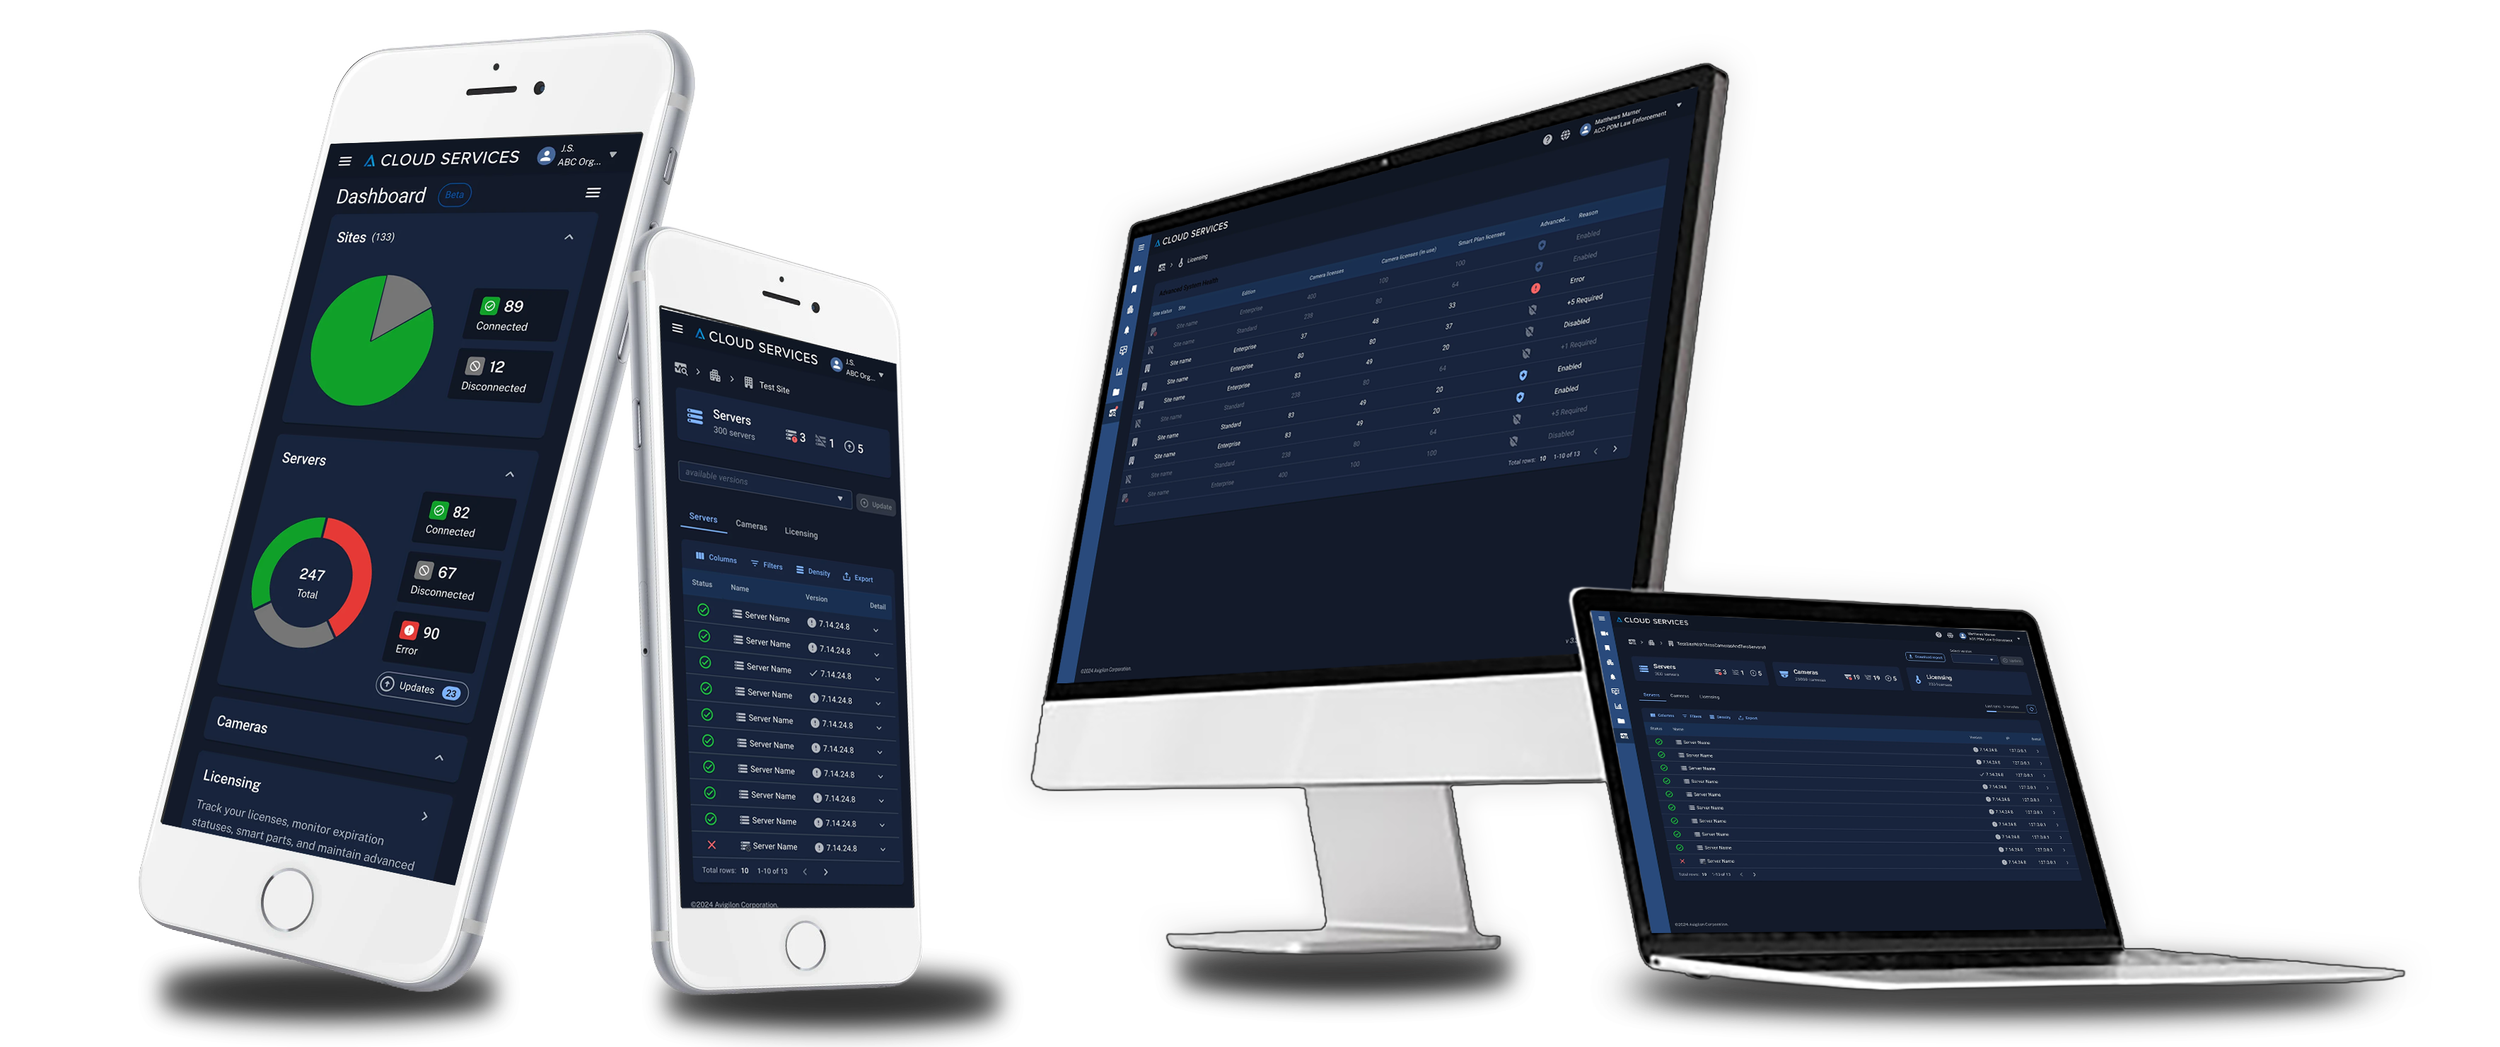
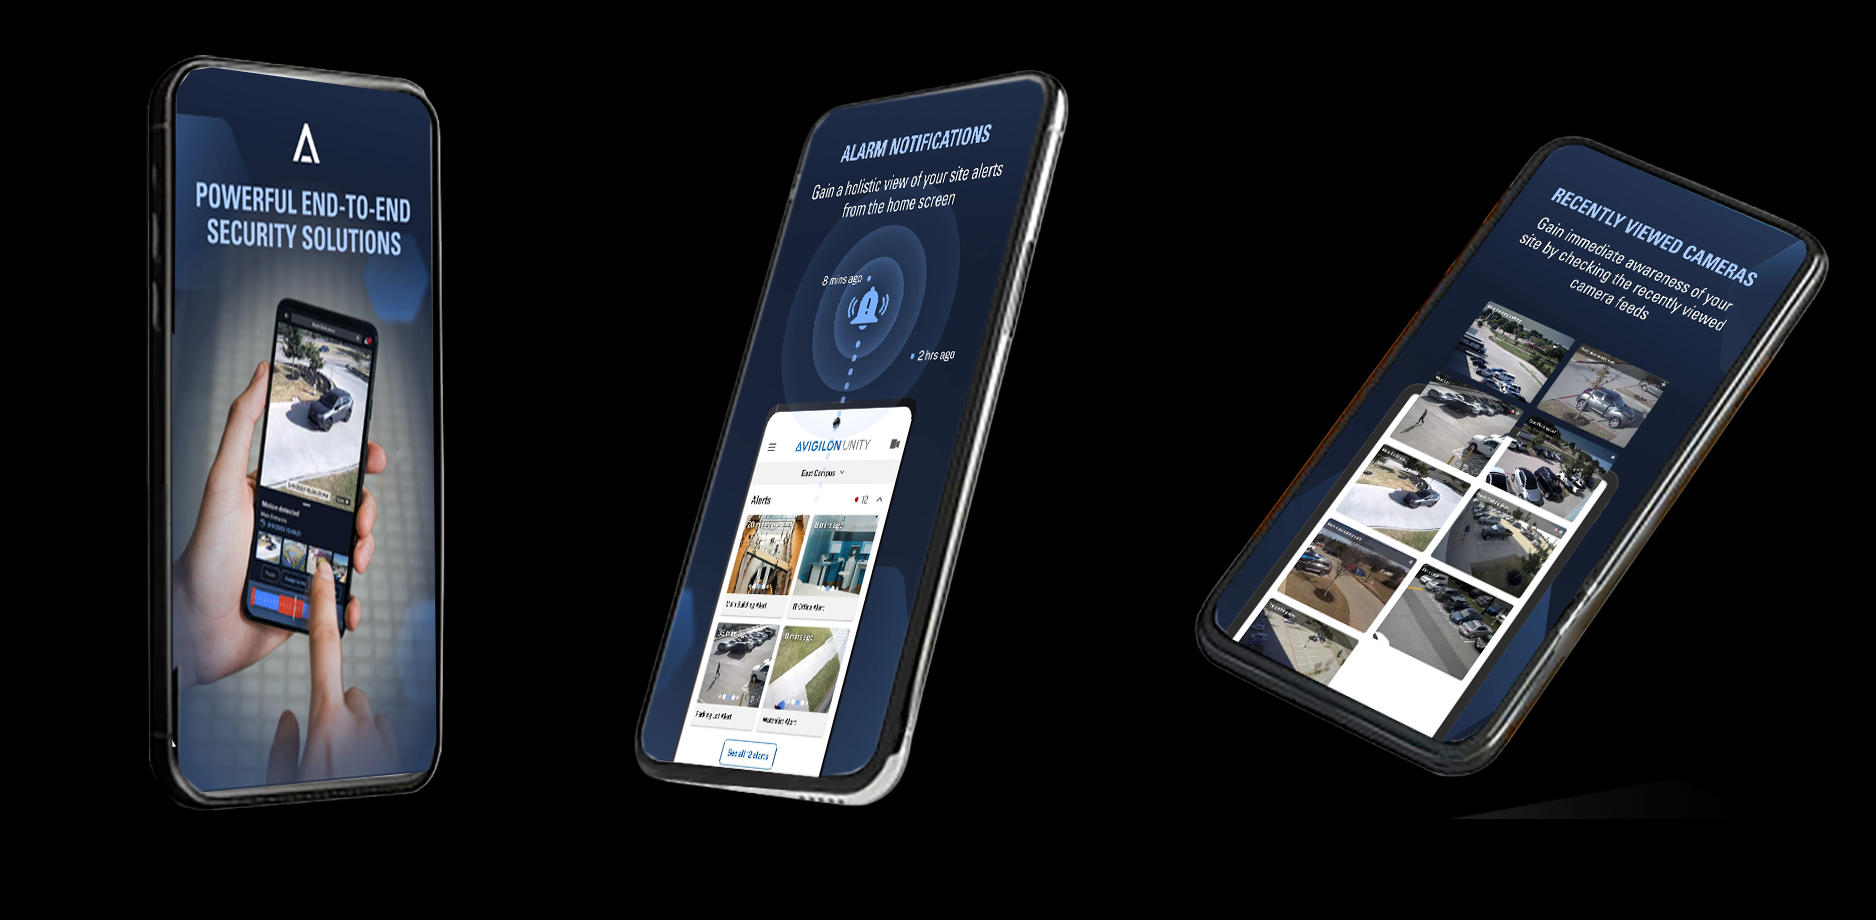
A centralized health dashboard and AI tagging to locate cameras and manage their health automatically by providing a "single pane of glass" that summarizes health across all cloud-connected Avigilon sites, servers, and cameras, with actionable insights and immediate intervention capabilities for enterprise-scale deployments. The design is custom and responsive, built to meet the needs of all viewports — mobile, tablet, and desktop.
Approach
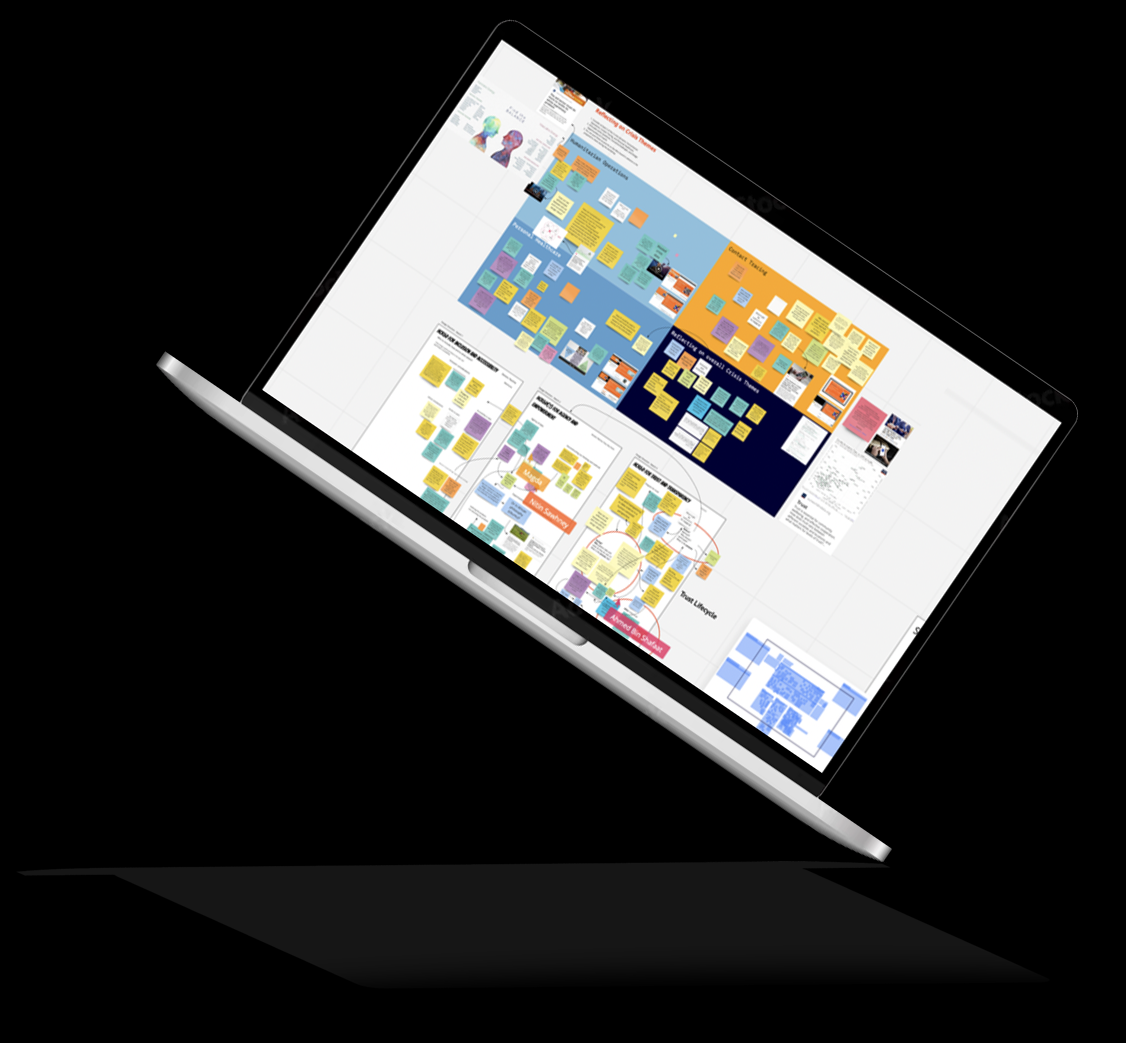
Systems Thinking Driven Discovery
Applied systems thinking to identify key pain points and opportunities in how administrators monitor, interpret, and act on system health signals across the Avigilon product ecosystem - examining not just individual tools, but the interdependencies between products, workflows, roles, and organizational constraints.
Internal ecosystem mapping through extensive interviews and card-sorting exercises with Product Management, Sales Engineers, Support, and other subject-matter experts to understand how “system health” is defined, measured, and communicated at scale—and where disconnects emerge across teams.
Contextual interviews with IT managers, system administrators, and security directors across higher education, logistics, and enterprise retail to surface how system health decisions propagate across technical, operational, and business layers.
Job shadowing with Support Engineers to observe real-time troubleshooting behaviors, escalation triggers, and handoffs—identifying feedback loops between customer actions, product limitations, and support load.
Support case analysis to uncover recurring system failures and systemic root causes (not just symptoms), including configuration debt, alert fatigue, and cross-product visibility gaps.
End-to-end journey mapping of diagnostic and escalation workflows to reveal breakdowns across tools, teams, and time—highlighting leverage points where improved system awareness could prevent downstream failures.
Competitive Analysis
Benchmarked top competitors and on-premises solutions (Genetec, Milestone) to surface best practices and pain points around status observability and dashboard visualizations. This analysis revealed common issues with information overload and lack of actionable insights.
Design Thinking Workshops & Early Insights:
Affinity Map Clusters
Visibility & Awareness
“I don’t know something’s wrong until a customer calls.”
“Health info is buried in different dashboards.”
“We need one place to see system uptime and camera status.”Theme: Lack of unified visibility and fragmented data.
Opportunity: Build a single-pane system health view with real-time status.
Prioritization & Signal Clarity
“Too many alerts — I can’t tell what’s critical.”
“Low battery looks the same as a full outage.”
“We need color coding or severity levels.”Theme: High noise, low signal clarity.
Opportunity: Introduce smart alerting with severity tiers, context, and relevance filters.
Actionability & Resolution
“It says camera offline, but what do I do next?”
“I waste time guessing what caused the issue.”
“We need troubleshooting steps right there.”Theme: Alerts don’t translate into action.
Opportunity: Create guided resolution flows and AI-assisted root cause suggestions.
Trust & Transparency
“Sometimes the system says a camera’s offline when it’s not.”
“False alerts make me stop trusting the dashboard.”
“I need to see why it flagged this issue.”Theme: Erosion of trust in system reliability.
Opportunity: Provide explainable diagnostics — show data source, timestamp, and confidence level for each alert.
Predictive & Proactive Health
“We always fix after it breaks.”
“Would love alerts before a failure — like overheating warnings.”
“AI should tell us what might fail next.”Theme: Reactive vs proactive system management.
Opportunity: Develop predictive maintenance models and early warning insights using telemetry data.
Key Insight
Admins didn’t want more data — they wanted clarity, confidence, and control.
System health needed to evolve from status reporting to situational intelligence.
This initial discovery gave us strong initial hypotheses
Prototyping
Led rapid prototyping using real data to validate design concepts — exploring D3 sunburst and other data-dense visualizations. While initial layouts were modeled in Figma, we advanced to interactive prototypes built with D3 and JSON to test component behavior, interactivity, and performance with live datasets.
Testing &Validation
Performance Testing
Partnered with engineering to stress-test the dashboard using data factory scripts, simulating enterprise-scale deployments with thousands of devices and real-time updates.
User Feedback Integration
Integrated Microsoft Clarity for analytics and heatmapping in CI to inform continuous design iteration before production launch.
Customer Validation
Conducted validation sessions with major enterprise clients, confirming alignment with key drivers for cloud adoption over on-prem solutions.
Optimizing Camera Operations with AI:
Health Monitoring and Scene-Based Tagging
Camera Health, an AI-powered feature to identify camera image quality and recording deficiencies.
Camera Tags helps user easily find cameras based on scene descriptions driven by AI.
Leadership & Learnings
Brought design, product, engineering and support together in co-creation workshops
Elevated research from “early-stage input” to a continuous strategy tool. We introduced Microsoft Clarity.
Drove accessibility and clarity across all views (high-contrast design, assistive labels, built-in help, etc.)
Created a framework for closing the research loop—a practice now replicated across Avigilon Cloud projects
Outcomes & Impact
50% reduction in support tickets for health-related incidents
40% faster resolution times reported by key enterprise clients
Used research insights to inform roadmap, not just polish the UI
Featured in EPF demos as a critical advancement in operational confidence
Video showing AI Tagging
What’s Next
Extending system health to include:
AI analytics readiness
Storage utilization forecasting
Mobile alerts for on-site integrators
Creating integrator dashboards for multi-site fleet health
Building auto-resolve logic using machine learning from recurring issue patterns
My Work
Motorola Solutions, AI Powered Physical & Digital SOC
Ford Motor Company, Global User Profile
Motorola Solutions, Advanced System Health
Chevrolet Corvette, The driver-centric cockpit experience
Ford Motor Company, Build & Price
Ford Pro Telematics, Enterprise Redesign at Scale
Ford GT, Back at Le Mans After 50 Years - Reveal & Configurator
Motorola Solutions, AAA Design Systems